

Charts
On the Charts tab of the Drill section true vertical depth (TVD) or vertical section (VSec) on HD dependency are displayed. To show or hide graph on the chart click on its legend above. Charts got switched from TVD to VSec by toggle above the chart.
Action buttons are placed on the left panel. To update the graph on the chart, click on the Reload button on the left panel. To zoom in the part of the graph select it by mouse cursor. If the graph is zoomed in Reset zoom button appear in the right top corner.
NS-EW direction chart displayed below the dependency. To zoom in the part of the graph select it by mouse cursor. If the graph is zoomed in Reset zoom button appear in the right top corner. Switching from TVD to VSec is applied to both graphs.
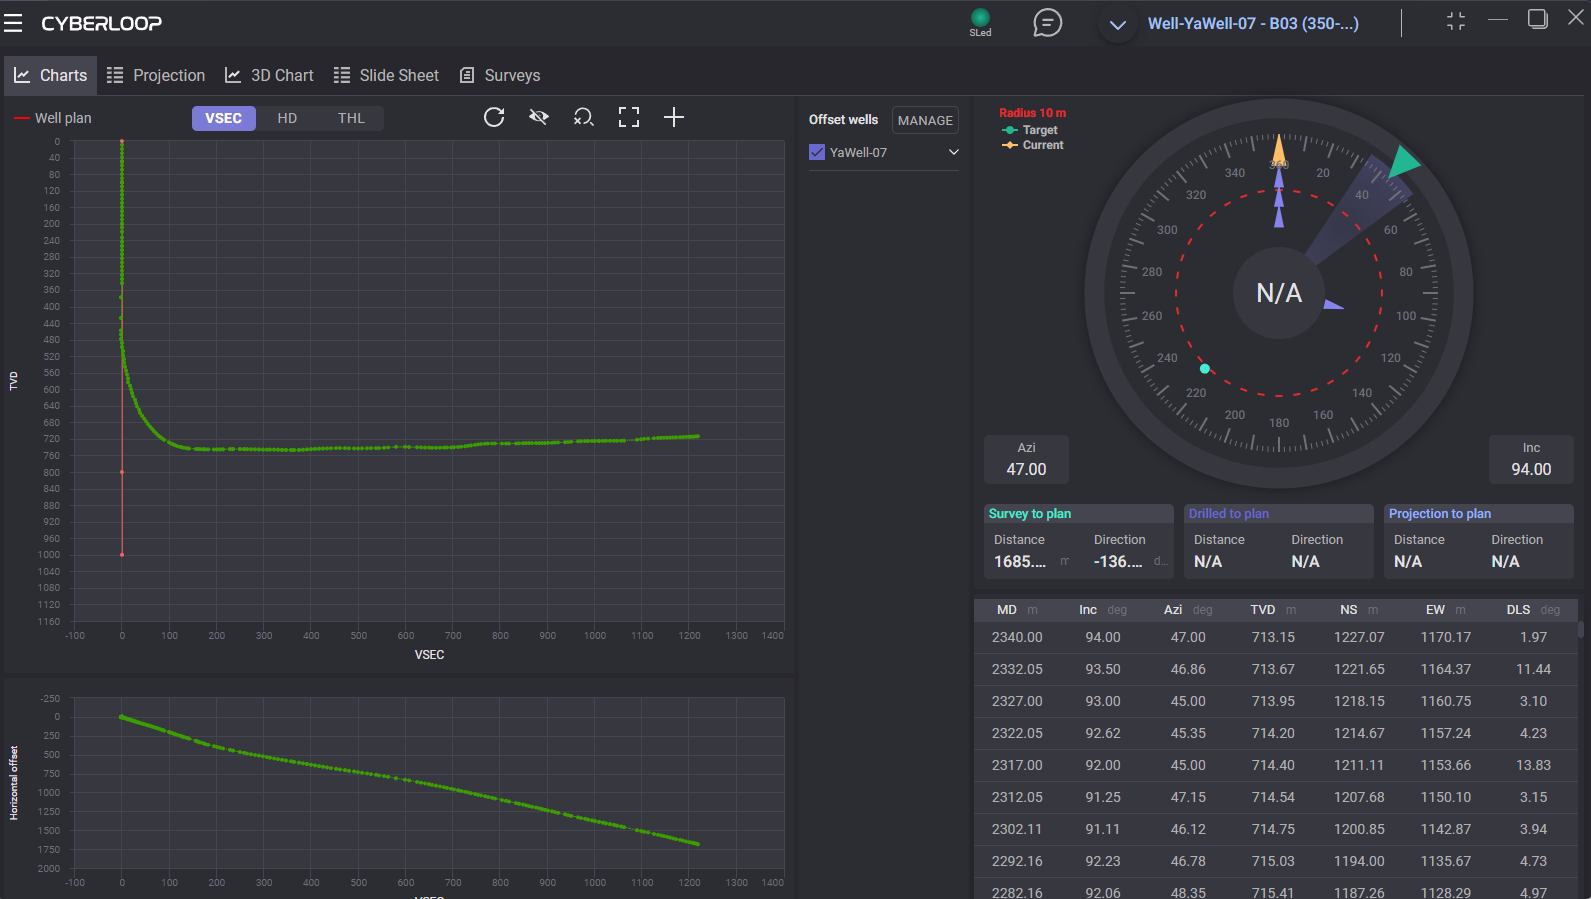
Target and current toolface angle values are displayed on the dial scale. To hide/display target or current value on the dial click on its legend above. To change the radius, click on the Radius above the dial scale and enter the radius value in the opened dialog and click on Save.
Below the dial scale azimuth and inclination values, distance and direction to plan for Survey, Drill bit and Projection are displayed. On the right side current values for Bit depth, Well depth, current Rigstate, Actual rpm, Gamma, Hook load, ROP, Standpipe, Rotary torque, Weight on bit are displayed.
Projection
On the projection tab drilling process can be simulated based on entered parameters. This allow User to model charts with corrected parameters based on last received data.
Top table contains last survey data. After adding projection simulated survey will be added below.
Click on +Create new projection part adds first projection to the list. You can select the value to enter for selected projection. If MD parameter is selected for the projection, then the measured depth value can be entered and CL calculated automatically. If CL is selected for the projection, then the MD will be calculated automatically. Type of drilling for projection can be changed from Slide to Rotary.
For slide projection can be defined following data: Inc/Azi. Br/Tr or Tf/Dls.
When the projection parameters are entered click on count button and simulated survey data will be added to the table and plotted on the chart. Next projection point can be added by clicking on “+“ button.
To delete added projection click on Basket button next to it and click on calculate button to update data in survey table and charts.
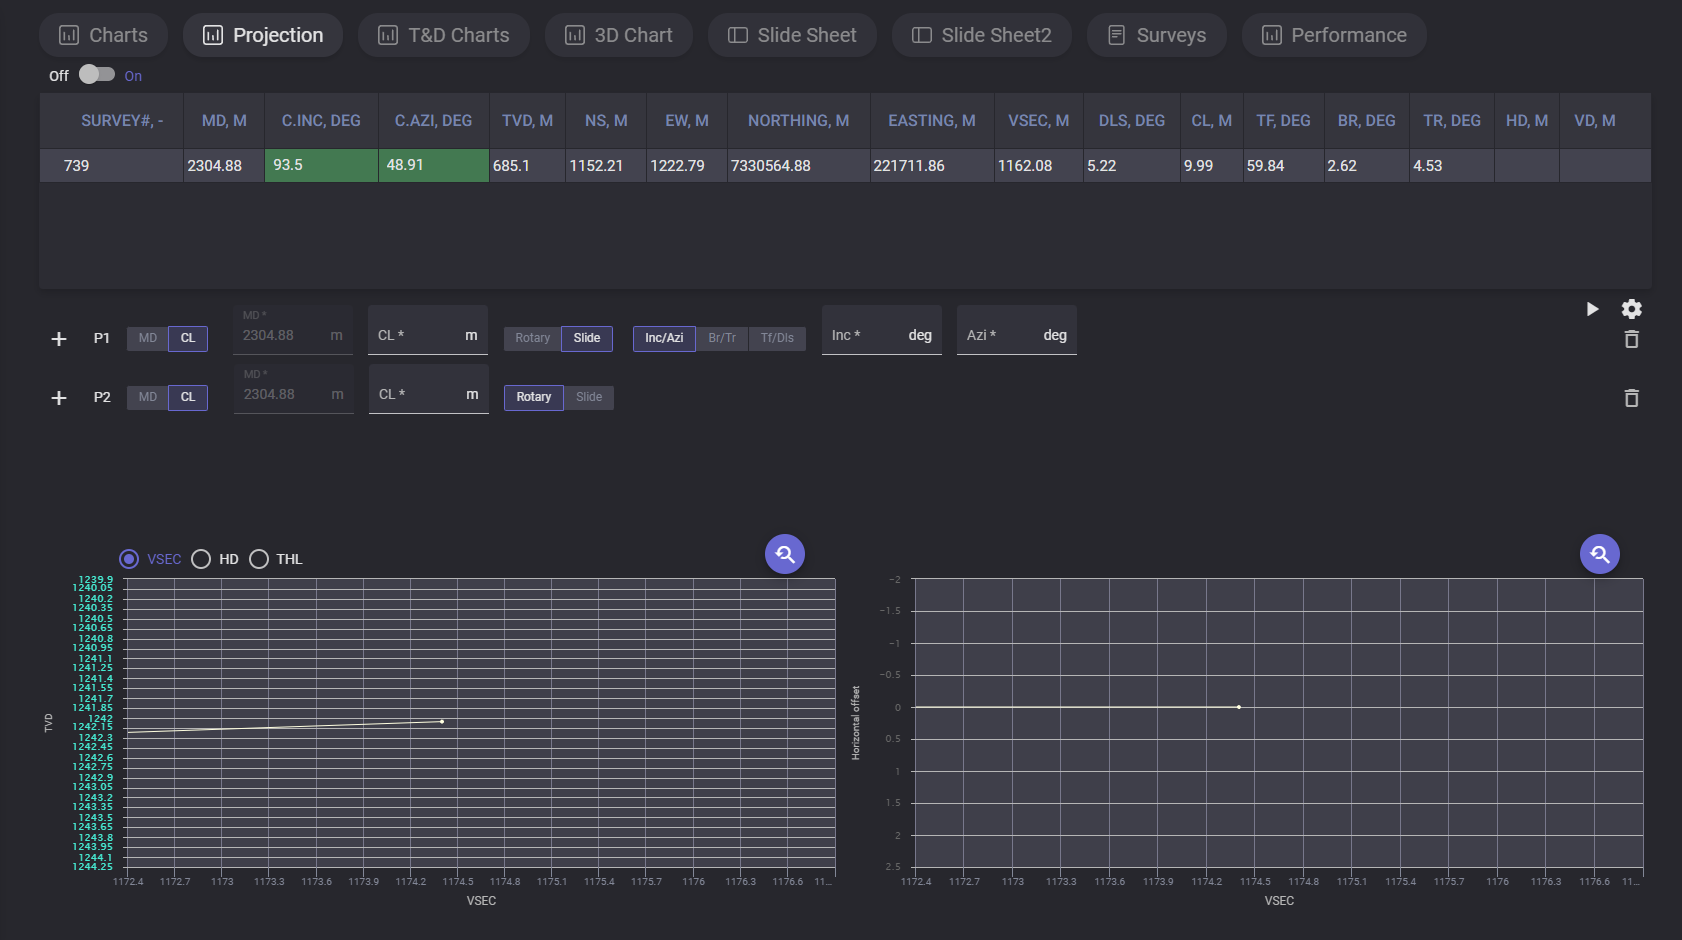
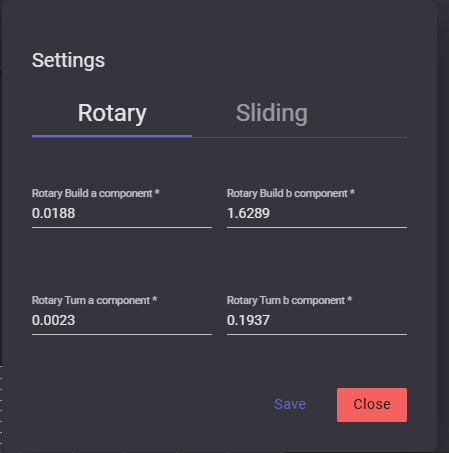
To change reference parameters, open settings dialog by clicking on gear button. In the settings modal window there are two tabs with parameters: Rotary and Sliding. On Rotary tab can be changed Rotary Build a component, Rotary Build b component, Rotary Turn a component and Rotary Turn b component values. On the Sliding tab dogleg Severity (DLS) angle value can be changed.
T&D Charts
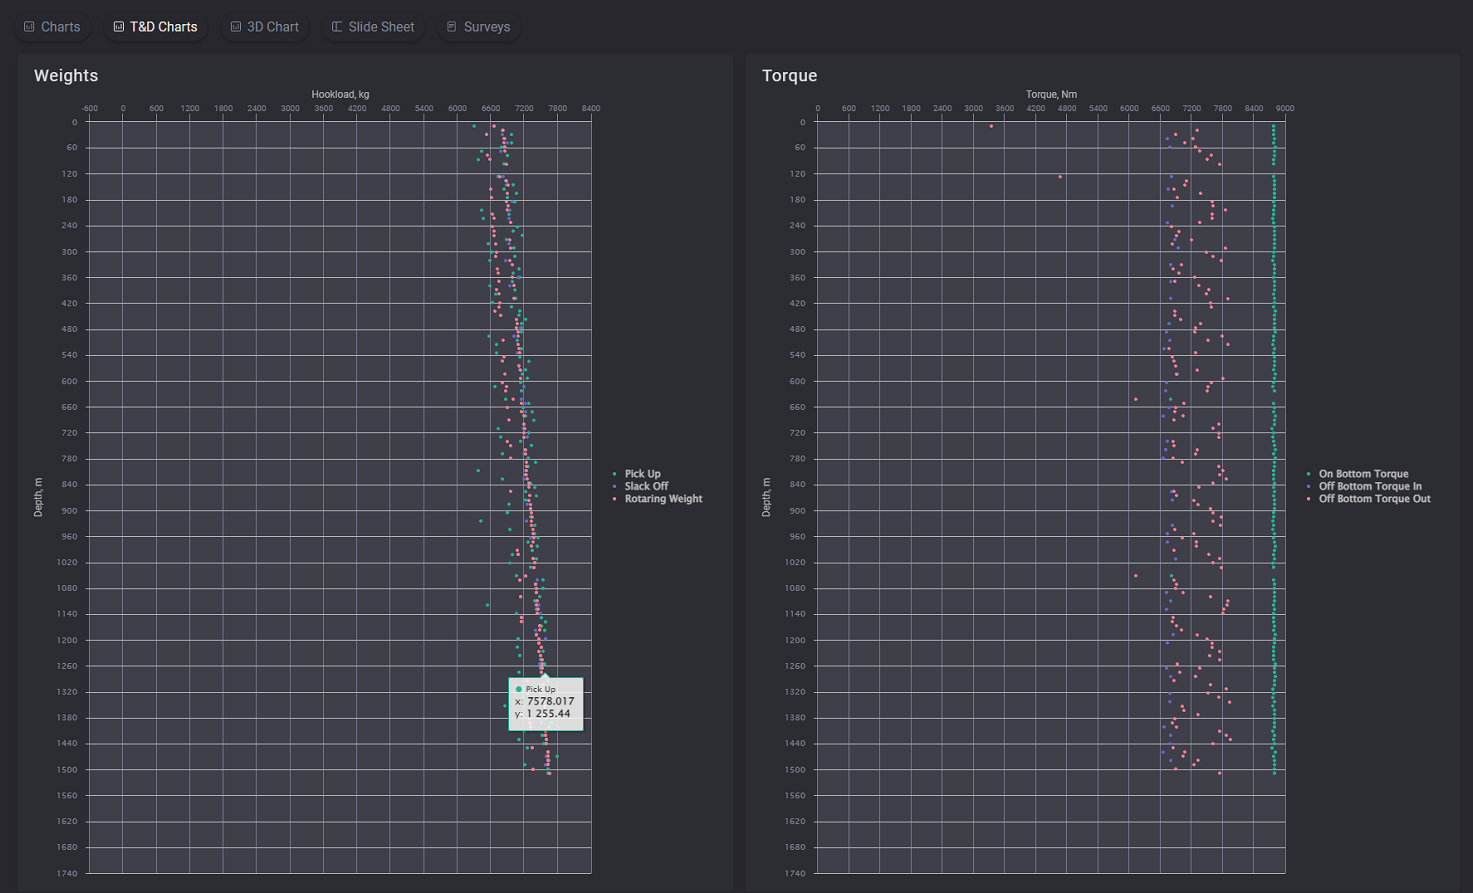
The Torque and Drag charts display the graphics for Weights and Torque.
On the Weight chart the dependencies of the hook load (kg) on depth (m) are plotted. On the Torque chart the dependencies of torque (Nm) on Depth (m) are plotted.
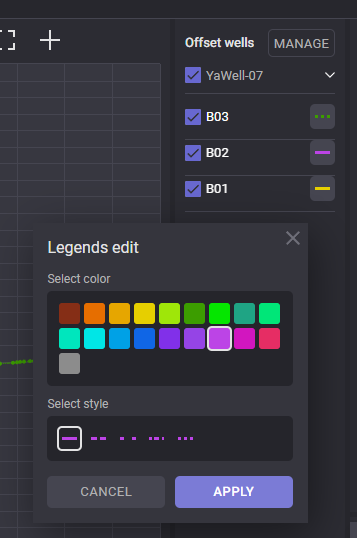
Plotted parameters and its chart color are defined in the legend on the right side of the chart. Exact values of the specific plotted point can be viewed on hovering on it on the chart.
3D Chart
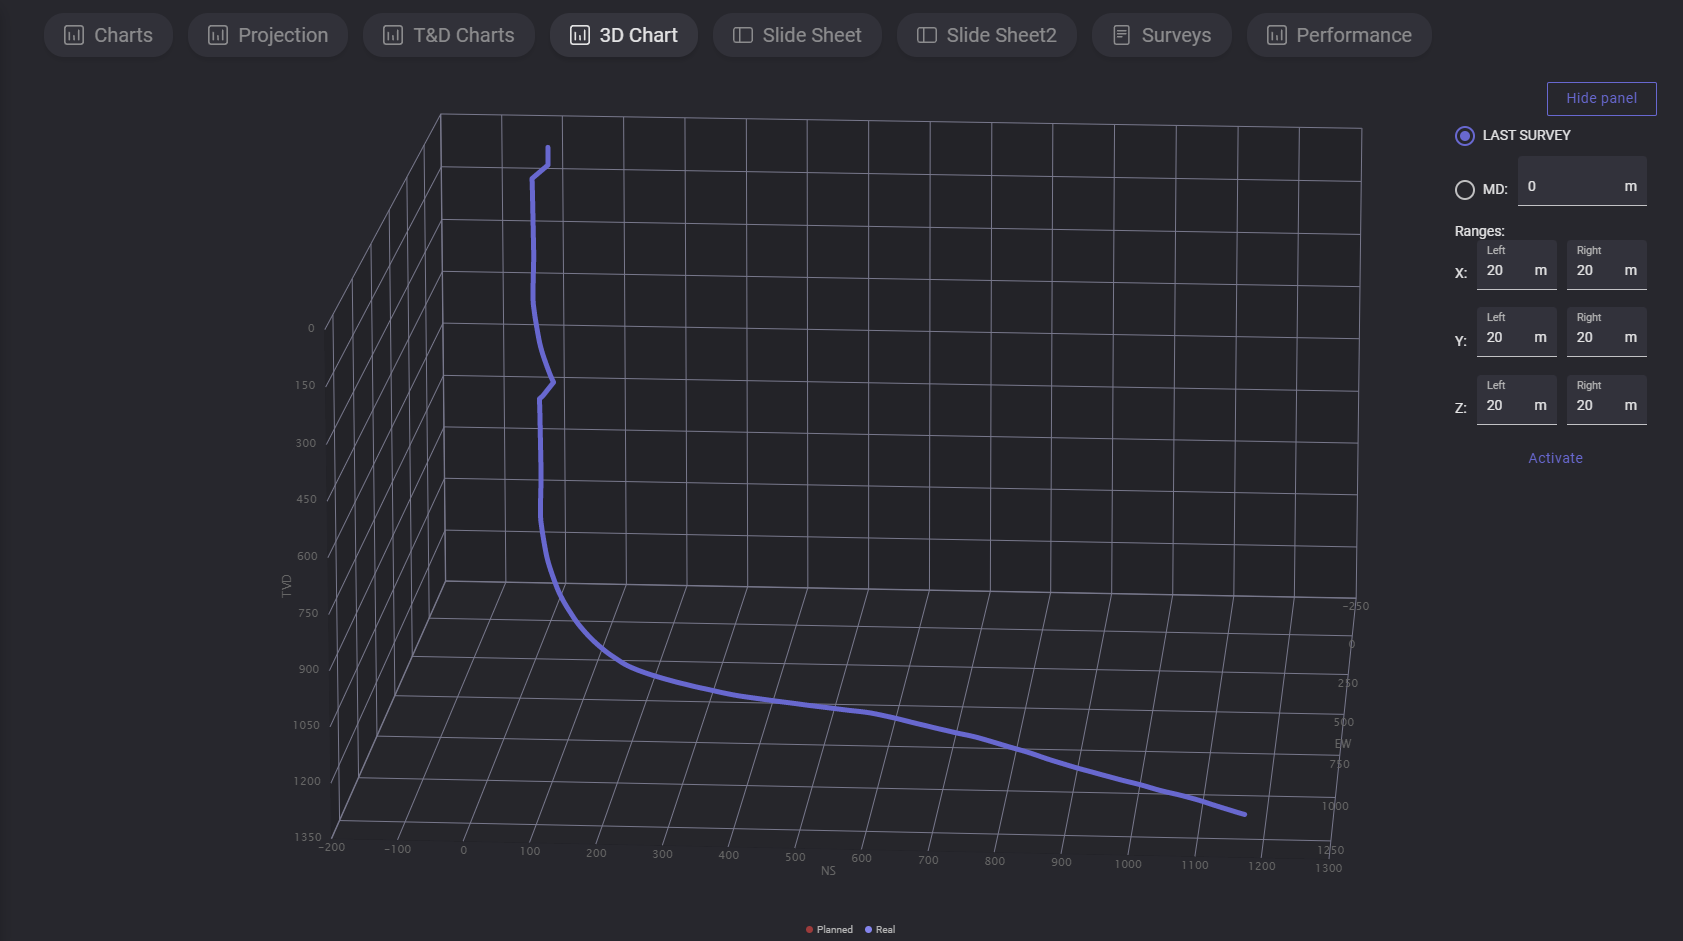
On the 3D Chart the 3-dimensional planned and real graphics on true vertical depth (TVD) are displayed. The graphics can be rotated by holding left mouse button.
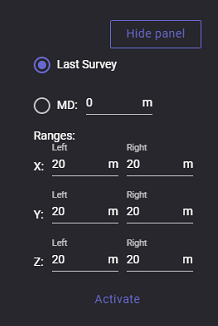
On the right panel current survey automatically plotted on the 3D chart can be switched to manual adjustment. Click on Show panel expands the panel with parameters. Selecting the corresponding radio button switch the mode. To change the graphic enter measured depth value in meters and define ranges for X, Y and Z axis that will be displayed. When all parameters are entered click on Activate button to apply changes on graphic. To reset the changes click on the Deactivate button.
Slide Sheet
The Slide Sheet is a summarized table of drilling parameters from a rotary drilling operation, including time, depth, weight on bit, rpm, torque, flow rate, standpipe pressure, and hook load over several intervals. Survey data including inclination and azimuth are also included at certain measurement depths.
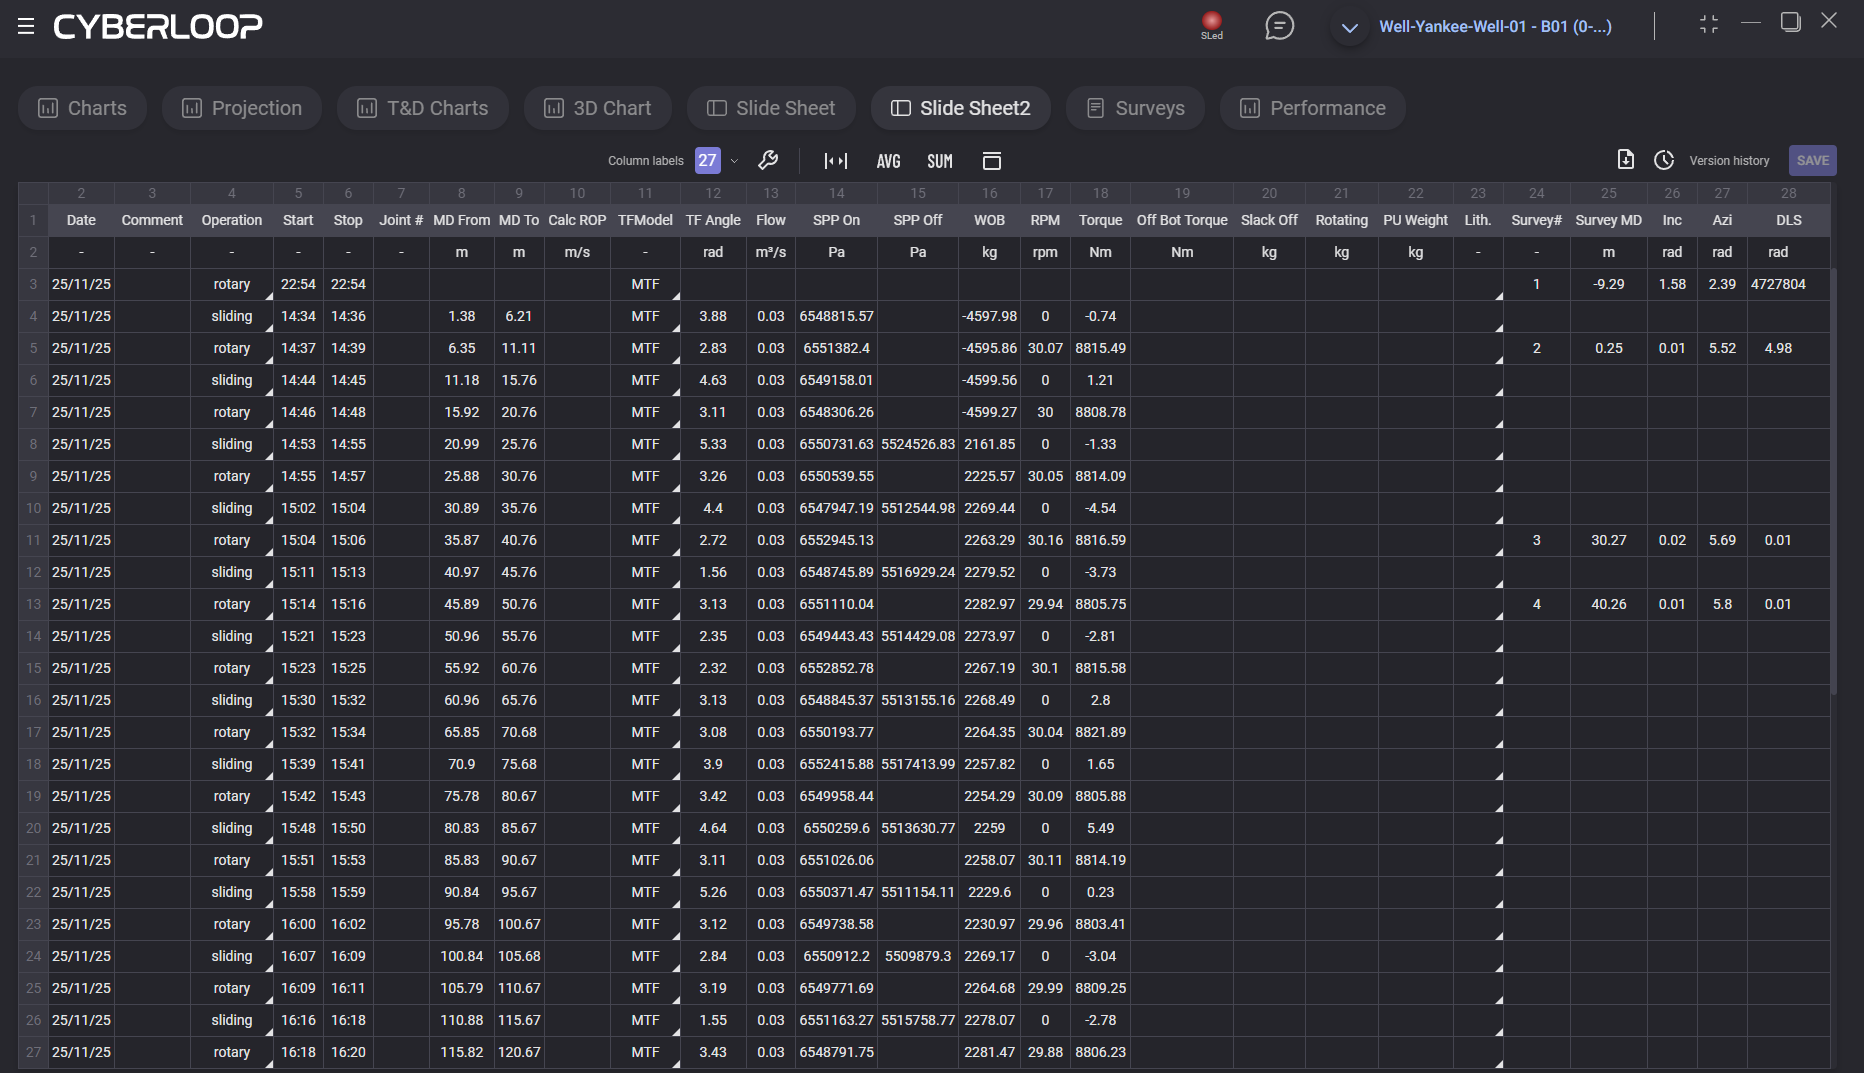
Slide sheet table contain following data:
Date - the date of the record
Comment - additional data on the record
Operation - operation type
Start time - time when the operation started
Stop time - time when the operation got stopped
Joint # - the number of the joint
MD From - Measured Depth where record starts
MD To - Measured Depth where record stops
Calc ROP - calculated rate of penetration
TF Model - Toolface reference: MTF for vertical/sub-vertical wells; GTF for inclination >3°
TF Angle - Toolface orientation relative to the selected reference
Flow - rate of fluid flow
SPP On -Standpipe pressure with bit on bottom
SPP Off -standpipe pressure with bit off bottom
WOB - downward force applied to a drill bit by the drill string to crush or shear rock
RPM - rotations per minute
Torque - how much a force acting on an object causes that object to rotate
Off Bot Torque - drillstring torque with bit off bottom
Slack Off - hookload while slacking off (running in hole)
Rotating - hookload while rotating
PU Weight - pumping unit weight
Lith. -Lithology
Survey - completed measurement of the inclination and azimuth of a location in a well
Survey MD - measured depth of survey station (bit depth minus bit lead
Inc - deviation from vertical, irrespective of compass direction
Azi - compass direction of a survey as planned or measured by a directional survey
DLS - dog-leg severity (°/30 m or °/100 ft)
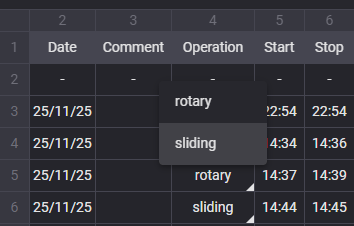
Data in the table can be edited by Directional driller manually. To change the value put cursor to the necessary cell and enter new value. Cells with arrows in the right bottom corner (Operation, TFModel, Lith.) got the fixed list of possible values. Click on the cell with arrow expands the drop-down list with possible values for the parameter.
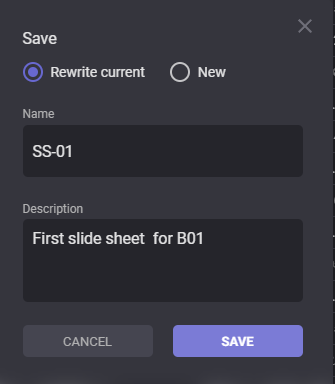
If at least one of the cells got updated value Save button become active. Click on Save button expands “Save” dialog with options for saving the version. There are two ways for saving changes of the slide sheet, to Rewrite current version so current version will be substituted with new data, or create new version, in this case current version will be preserved in the version history and can be restored.
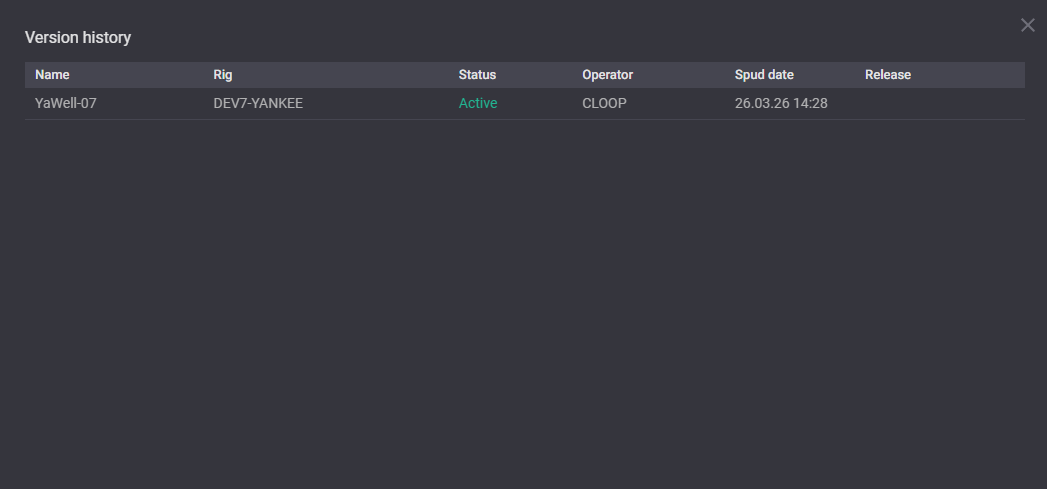
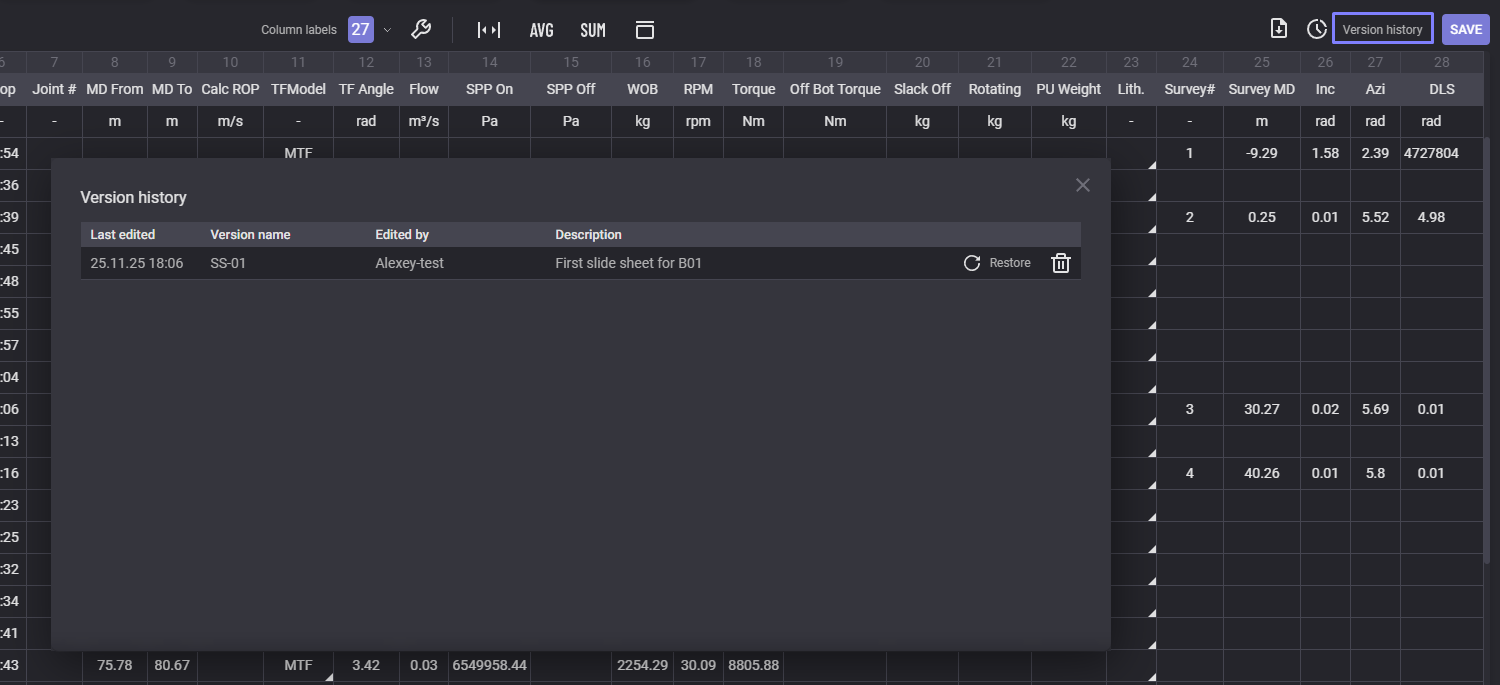
To view list of existing versions click on the Version history option. The list of versions display all available versions with creation date and author. The version can be got back by click on Restore option next to it or removed from the version history by clicking on the Delete button.
To load header with average values click on AVG button. Additional rows will be added with Minimum, Average and Maximum.
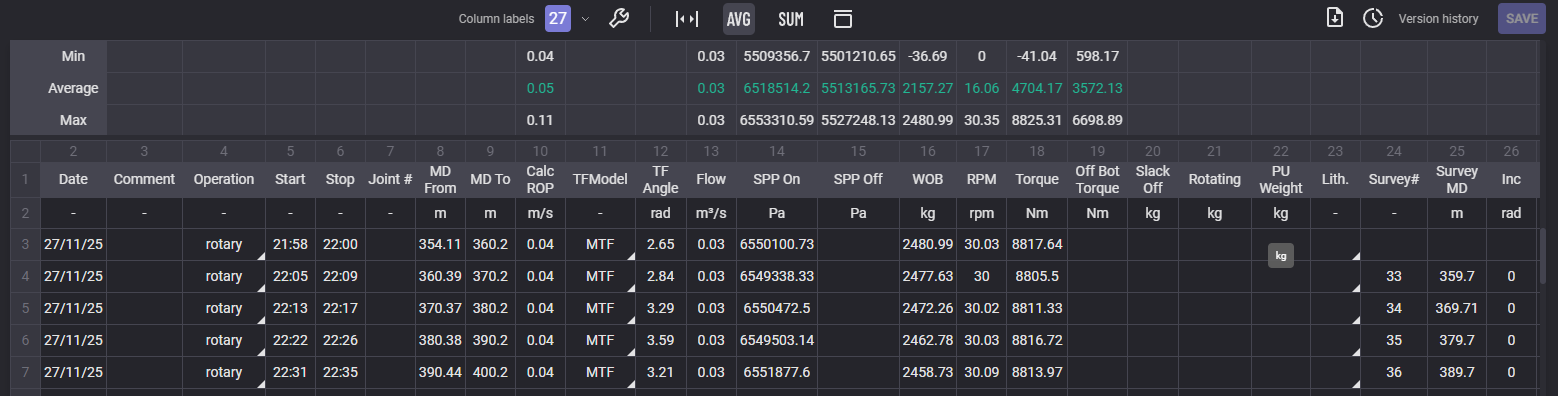
Additional table with summary can be added by clicking on SUM button. If the SUM option is on the table with summary will be included to the pdf report.

Report can be downloaded in pdf, xlsx, csv format. To download report click on the export button 
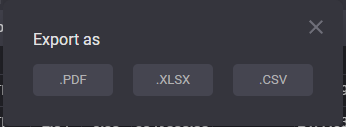
Loading process will be started after clicking on selected format.
Survey
On Survey tab represented the table of measuring and mapping the trajectory and location of a borehole.
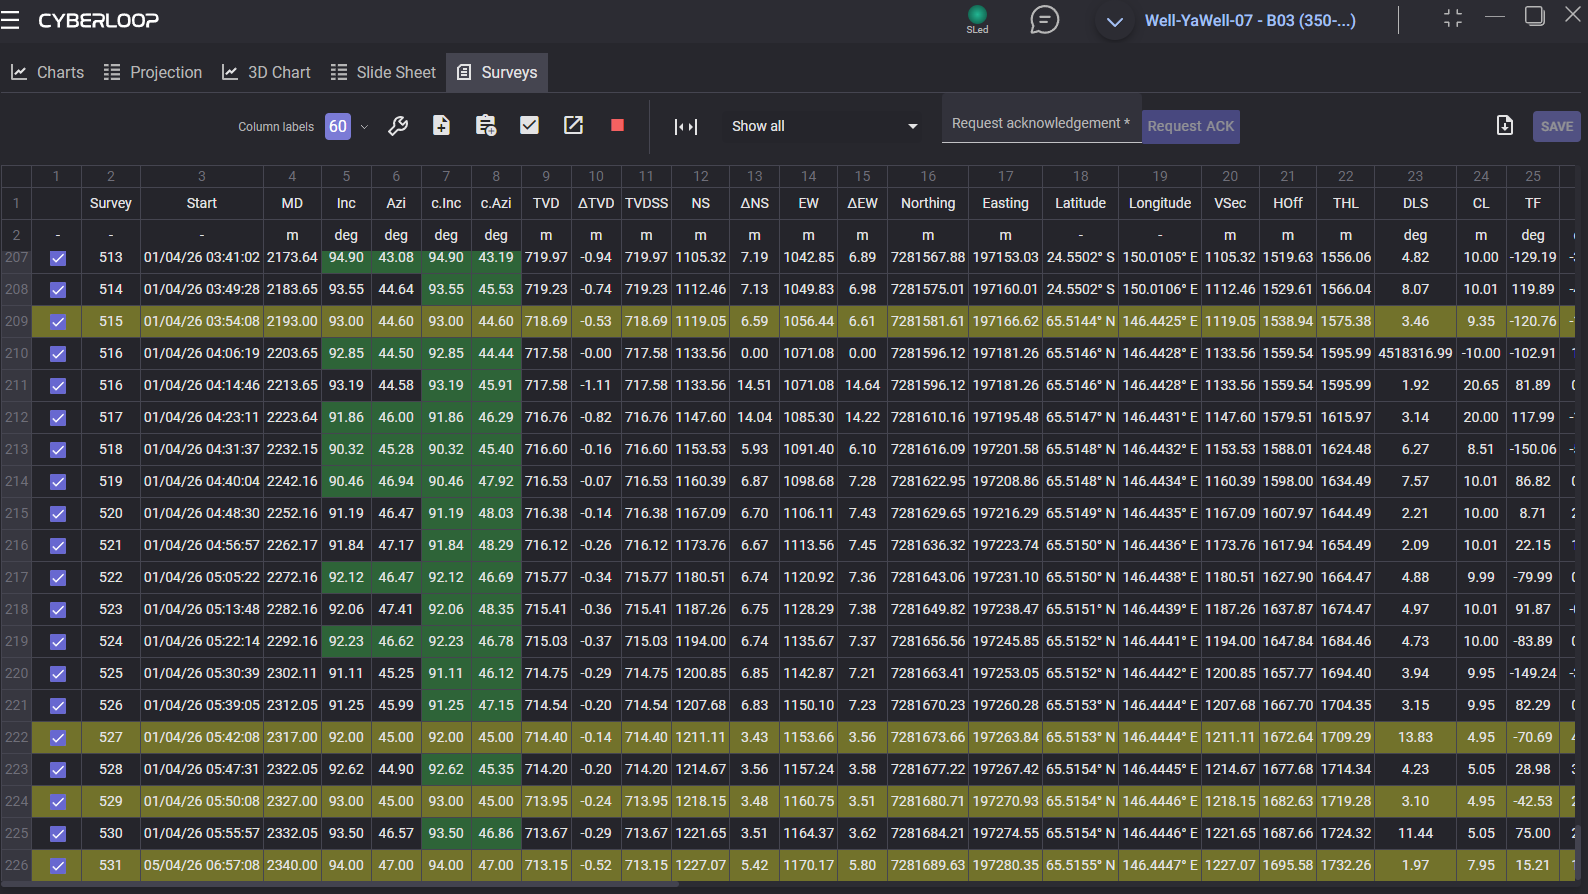
For the survey provided list of parameters:
-
Survey - number of survey;
-
Strart - date and time when mesurment started ;
-
MD - measured depth;
-
Inc, deg - deviation from vertical, irrespective of compass direction;
-
Azi, deg - compass direction of a survey as planned or measured by a directional survey;
-
c.Inc, deg - corrected inclination;
-
c.Azi, deg - corrected azimuth;
-
TVD, m (true vertical depth) - vertical distance from a surface reference point to a point in a wellbore, calculated perpendicular to the surface;
-
ΔTVD - the change in true vertical depth between two points in a wellbore;
-
TVDSS - true vertical depth measured to a sea-level data;
-
NS, m - north-south direction depth;
-
ΔNS, m
-
EW, m - east-west direction depth
-
ΔEW, m
-
Northing. m - the distance to the North or the South;
-
Easting, m - the distance in meters from a central meridian line;
-
Latitude - coordinate used to specify the north-south position of a location;
-
Longitude - a coordinate used to specify the east-west location on the surface of the Earth;
-
VSec, m - vertical sectioning: horizontal displacement projected onto the reference azimuth;
-
HOff, m -– Horizontal Offset; plan-view distance from surface location to the wellbore;
-
THL - True Horizontal Length; cumulative horizontal displacement along the wellbore;
-
DLS (dogleg severity) - the rate of change in a borehole's direction (inclination and azimuth);
-
CL (caliper log) – Connection Length; length drilled per pipe connection;
-
TF, deg – Measured toolface angle from the downhole tool;
-
BR. deg – Build Rate; change in inclination between surveys;
-
TR, deg – Turn Rate; change in azimuth between surveys;
-
HD, m – Horizontal Distance; incremental horizontal displacement;
-
VD, m – Vertical Distance; incremental vertical displacement;
-
DIST, m - minimum distance from survey to the planned well path;
-
DIRECT. deg – Direction from survey point to closest point on the well plan;
-
cl.AZI, deg - Calculated azimuth at the closest point on the well plan;
-
G – Gravity field magnitude used for survey calculations;
-
B – Uncorrected magnetic field magnitude used for survey calculations;
-
Dip – Magnetic dip angle; inclination of the Earth’s magnetic field;
-
c.B – Corrected magnetic field magnitude (short-collar correction applied);
-
c.Dip – Corrected magnetic dip angle (short-collar correction applied);
-
ngZone – No-Go Zone status as defined in system settings;
-
Well ID;
-
Section ID;
-
Run name;
-
Comment
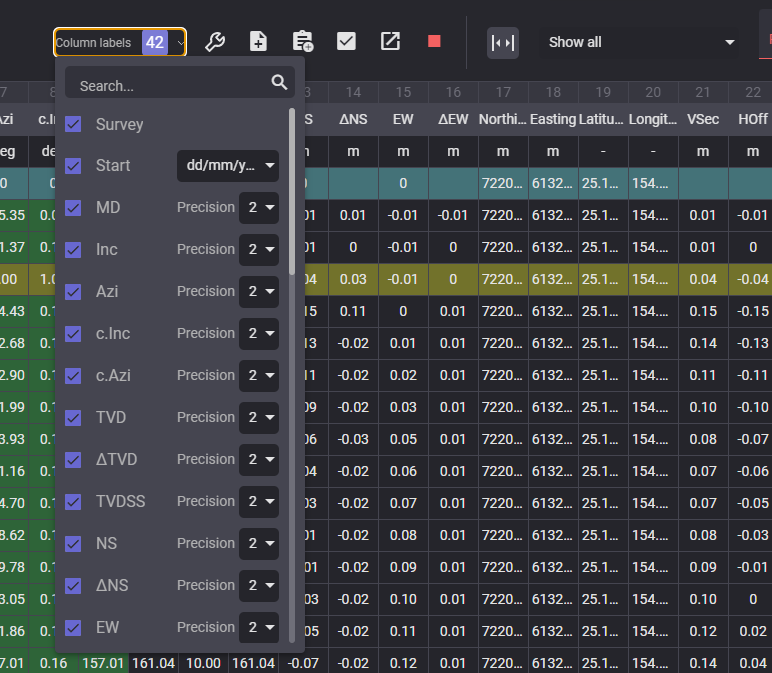
Visibility of the columns can be set up in the Column labels drop-down list. To hide the column untick checkbox next to it. Precision of the numeric values can be changed in the Column labels dro-down
If the inclination and azimuth values corresponds to values, defined in Tolerance c.Inc and c.Azi cells are colored in green. This values can be corrected manually in c.Inc, deg and c.Azi columns. When the value is corrected, click on Save the survey button to apply the changes to the whole table.
When the values are counted wrongly, the entire row of the survey colored in red.
The table can be filtered by selecting the filter in the drop-down list above the table.
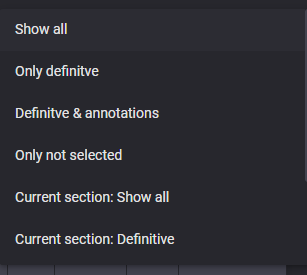
Selected filtering will also be applied in the imported report.
Above the table place action buttons:


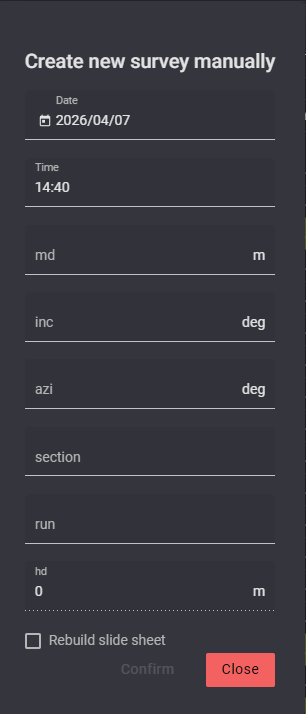
The date and time of the new survey should be defined correctlyto place new row in correct place in the table.
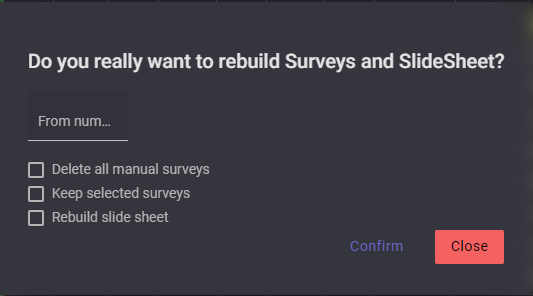
To start rebuilding of the Slide sheet after adding new survey tick the corresponding checkbox in the Create new survey manually dialog.

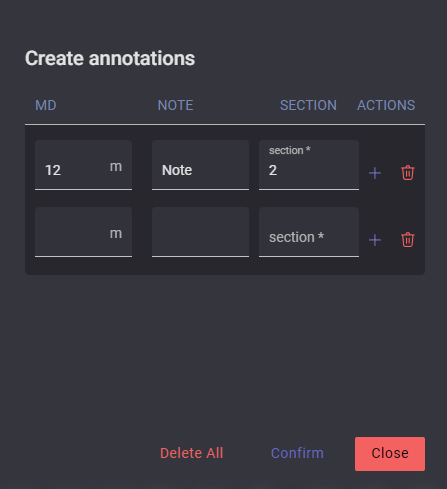
To add several annotations in one action click on “+“ button to create new empty row for another annotatiton.


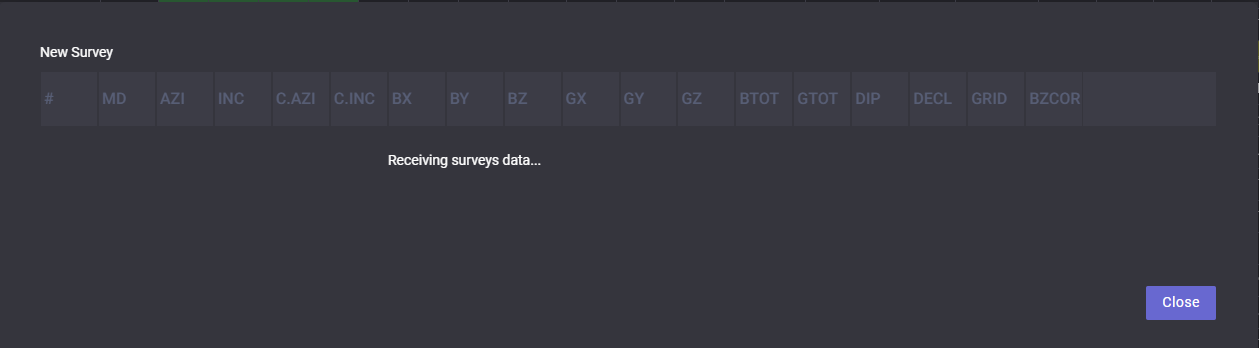

Note: the section should be active

Manually created survey can be edited or deleted. To expand the options drop-down click on the row number of the manually added survey.
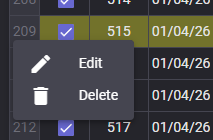
Click on Edit opens dialog alloing to edit the survye parameters and data.
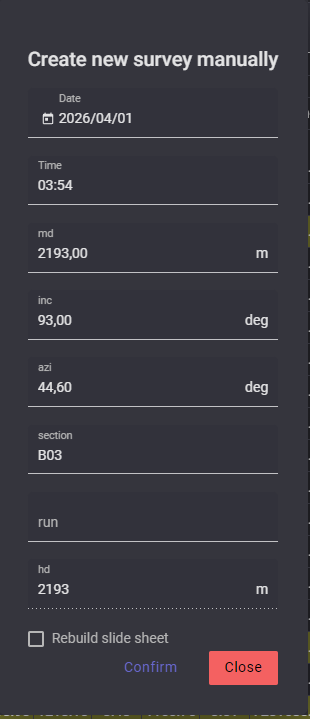
Deviation Plots
Deviation plots tab represents the visualization of actual path and planned path of the borehole. It allow to compare paths and verify if the process goes in the planned way.
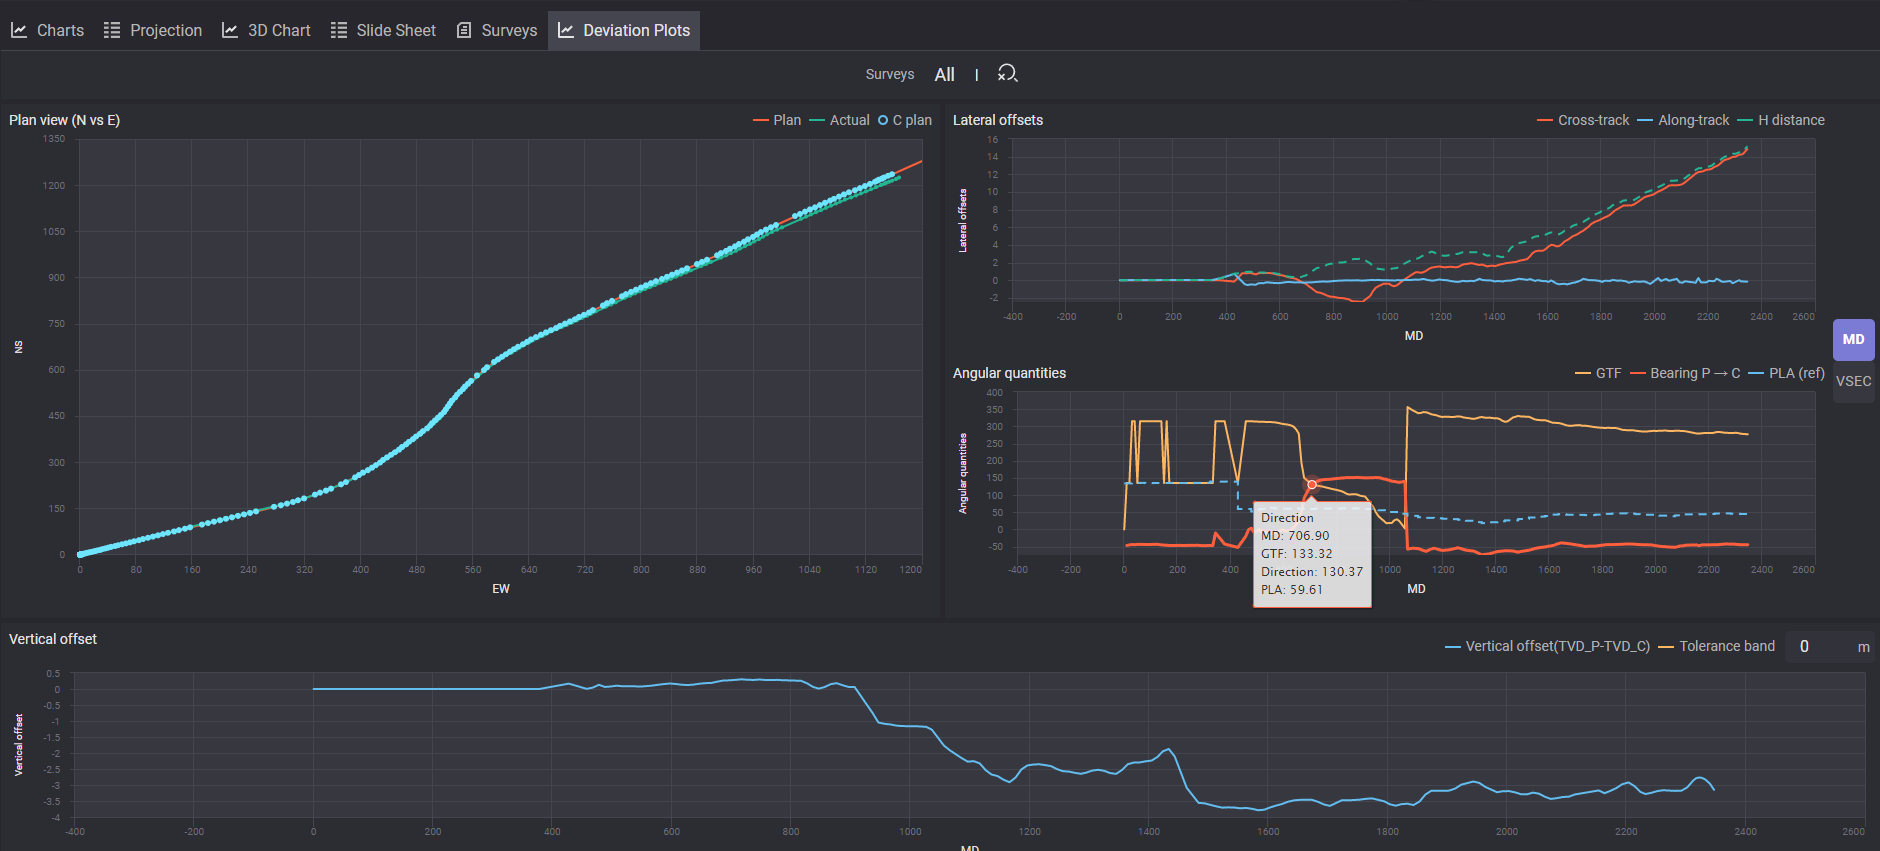
Lateral offset chart represent the horizontal deviation. It’s a horizontal distance between the actual wellbore position and its planned trajectory at a specific depth.
Angular quantities display the directional measurements used to define the wellbore's path in 3D space. It describe the actual orientation of the drill bit
Vertical offset display the difference between the actual depth of the bit and the planned depth at any given point along the wellbore's horizontal progress.